
7 Jun
2023
7 Jun
'23
10:30 a.m.
*** APOLOGIES FOR CROSS-POSTING ***
We invite you to the workshop:
Creating custom visualization templates with RAWGraphs 2.0
20 September 2023 @ CHItaly conference (Turin, IT)
[6475b91bf36e14ee9baac43b_Screenshot 2023-05-30 at 10.50.28.png]
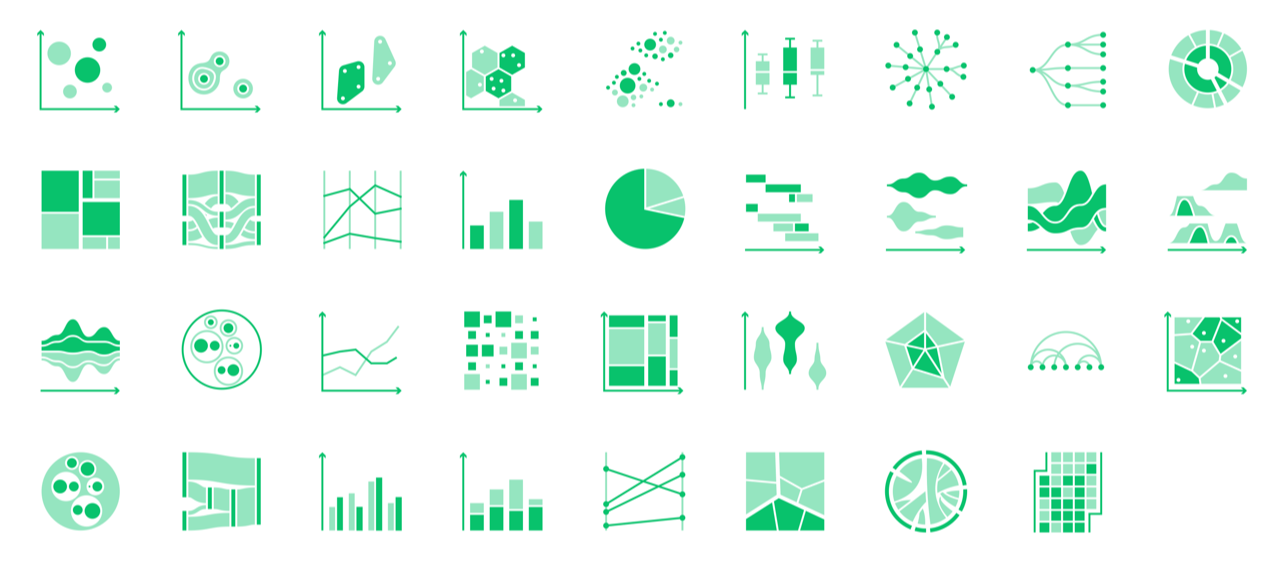
Focusing on expanding access to data visualization, RAWGraphs (https://www.rawgraphs.io/)
is an open-source software that offers a variety of visualization templates, such as
Sankey diagrams, bubble charts, bump charts, horizon charts, and many more.
In this upcoming workshop, participants will be taught how to develop custom visualization
templates using RAWGraphs. The new version, 2.0, has simplified the process of creating
templates, allowing for easy usage through a straightforward loading function (to be
released soon). This 4-hour workshop will be held during the CHItaly 2023 conference and
is intended for visualization experts, designers, developers, and researchers (including
PhDs) who desire to create specialized tools to support specific requirements and/or
progress in their research. Our objective is to guide participants in creating 5 new
templates. Hence, a fundamental prerequisite is a good understanding of data visualization
and Javascript development.
Participation is possible as individuals or groups. It is also possible to participate in
the idea of someone else in case you just want to learn more about the software.
Use this form to submit your participation: https://forms.gle/gbzLzUM7DSdg8JhM7
Further information at https://www.rawgraphs.io/ws-chitaly2023
Important dates
Deadline for submissions: 23 June 2023 (11:59 p.m. AoE)
Notification to authors: 14 July 2023
Date of the workshop: 20 September 2023 (detailed schedule TBA)
Feel free to contact us in case you need further information at:
hello@rawgraphs.io<mailto:hello@rawgraphs.io> (with email subject: WS CHItaly
2023).
Best,
The RAWGraphs Team
Tommaso Elli, PhD
–
Junior Researcher
Dipartimento di Design, Politecnico di Milano
dipartimentodesign.polimi.it<http://dipartimentodesign.polimi.it/>
–––
Recent publications
Elli, T., Benedetti, A., Pallacci, V., Spadini, E., & Mauri, M. (2023). Designing
network visualizations for genetic literary
criticism<https://doi.org/10.53681/c1514225187514391s.31.176>76>. Convergences -
Journal of Research and Arts Education, 16(31), 25–38
Elli, T., Bradley, A., Hinrichs, U., & Collins, C. (2022). Visualizing Stories of
Sexual Harassment in the Academy: Community Empowerment through Qualitative
Data<https://dl.designresearchsociety.org/drs-conference-papers/drs2022/…4/>.
Proceedings of DRS 2022, Bilbao
Parigini,M., Elli,T (2022). The Shape of Doubt: Employing data visualization to inquiry
stylistic features in the narrative works of Italo
Calvino<https://zenodo.org/record/6573372>72>. DH Benelux 2022
Mauri, M., Vantini, S., Gobbo, B., Elli, T., Aversa, E., Benedetti, A., Briones Rojas, M.
D. L. A., & Colombo, G. (2022). Making posters to understand statistics: Towards a
didactical approach in communication
design<https://dl.designresearchsociety.org/drs-conference-papers/drs202…01>.
Proceedings of DRS 2022, Bilbao
Elli, T (2022). Research through Visualization in Literary Criticism. Adaptations of data
visualization to scholars’ interpretive
work<https://drive.google.com/file/d/1TK0OCk_MseNV1HEy2aIrgqfkktZJGUy1/v…
[Doctoral Thesis]. Politecnico di Milano
970
days inactive
970
days old
0 comments
1 participants
participants (1)
-
 Tommaso Elli